 Joe Tigay
 Understanding the SPIKES Index: A Tool for Investing in Volatility
Volatility, often regarded as a challenging and unpredictable aspect of the market, plays a crucial role in options trading. To navigate this dynamic landscape, traders and investors turn to volatility indexes like the SPIKES, which measures volatility on the SPDR ETF SPY. In this blog, we’ll explore how the SPIKES Index can be used as a valuable tool for investing, understanding how to trade it, and what to expect from it.
First and foremost, it’s important to recognize that volatility is not something that can be “broken.” It is merely a calculated metric utilized by options traders to forecast the potential movement of a specific stock or future over a certain period. While volatility doesn’t always behave predictably, dismissing volatility indexes like SPIKES as “broken” fails to grasp the fundamental nature of volatility as an essential aspect of market dynamics.
Unlike traditional assets such as stocks, bonds, precious metals, or real estate, which are often bought and held with the expectation of long-term appreciation, volatility operates differently. Volatility does not exhibit long-term appreciation but instead reverts to its mean. This key distinction underscores the importance of understanding volatility as a distinct investment asset.
So, how can one effectively trade volatility using the SPIKES Index? Let’s explore three significant trends to consider:
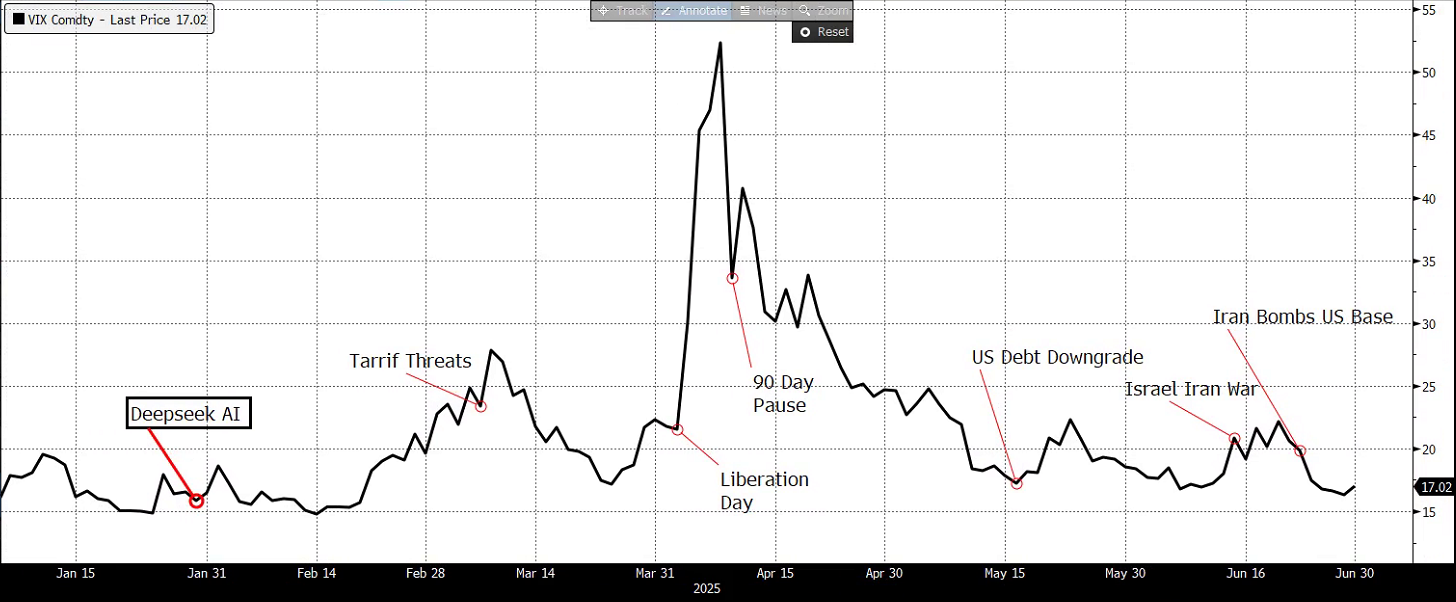
Trend 1: Volatility Spikes Ahead of Major News Events
Volatility often experiences a spike leading up to significant news events such as Brexit, elections, jobs reports, and Fed meetings. This surge in volatility stems from increased uncertainty surrounding these events. Once the uncertainty dissipates, volatility tends to have an easier time declining than rising. Traders can capitalize on this trend by positioning themselves accordingly.
Trend 2: Contrarian Indicator at the End of Bear Markets
Typically, volatility rises when stocks fall. However, at the end of a bear market, there is often exhaustion in selling, resulting in less panic-driven activity. Observing the market make a confirmed bottom without a relative high in the SPIKES Index can serve as a contrarian signal that the worst may be behind us, potentially indicating a market ready to rally.
Trend 3: Volatility and Interest Rates High interest rates are associated with elevated volatility.
This correlation is rooted in the idea that high interest rates aim to slow down the economy, which tends to be accompanied by higher volatility. Conversely, when interest rates start to fall, volatility may be expected to decrease. Traders should anticipate the highest volatility when interest rates begin to rise and the lowest volatility when interest rates start to decline.
It’s essential to approach volatility trading with caution and a comprehensive understanding of the underlying dynamics. Traders and investors should stay informed about market events, closely monitor the SPIKES Index, and employ risk management strategies to navigate volatility effectively.
The SPIKES Index provides valuable insights into the dynamics of market volatility. By recognizing and leveraging key trends, traders can develop informed strategies and make more informed investment decisions. Understanding volatility as a distinct asset class and appreciating its unique characteristics are crucial for success in navigating the ever-changing landscape of the financial markets.