 Joe Tigay
 Understanding Volatility Indexes
As someone who is fascinated by volatility, my daily routine revolves around monitoring the SPIKES Volatility Index and VIX charts. The SPIKES index is a measure of expected 30-day volatility in the SPDR® S&P 500® ETF (SPY), while the VIX measures volatility on the S&P 500 futures. This constant exposure to volatility trading has made me a natural contrarian. I find it thrilling to challenge conventional wisdom and offer a unique perspective that goes against the crowd.
The stock market is a dynamic and complex system that is influenced by various factors, including investor sentiment, economic indicators, and global events. One critical indicator that traders and analysts often rely on to assess investor sentiment is SPIKES, which measures volatility on the SPY ETF. In this blog post, we will explore whether SPIKES needs to peak for the stock market to bottom.
Contrarian Indicator
Volatility is a natural contrarian indicator as it can signal overconfidence or extreme fear. The famous quote “buy when others are fearful and sell when others are greedy” rings true, and this is especially relevant in the world of volatility trading. A relative low in the stock market and a relative high in volatility are everyone’s favorite contrarian indicators, and volatility traders patiently wait for this signal to make their move.
SPIKES is often used as a contrarian indicator, meaning that when it is high, it suggests that investors are fearful and the market is oversold, which could signal a bottom. Conversely, when SPIKES is low, it suggests that investors are complacent and the market may be overbought, which could signal a potential top.
Peaks and Troughs
One reason why SPIKES needs to peak for the stock market to bottom is that it reflects the level of fear and uncertainty in the market. When investors are fearful and uncertain, they tend to sell stocks, which can lead to a downward spiral in stock prices. However, when SPIKES peaks and begins to decline, it suggests that investors are starting to feel more confident and that the worst may be over.
Another reason why SPIKES needs to peak for the stock market to bottom is that it can provide a signal for potential buying opportunities. When SPIKES is high and the market is oversold, it can present an opportunity for investors to buy stocks at a discount. This can help to stabilize the market and lead to a potential recovery.
Waiting for a signal
A lack of a new high in volatility could indicate that there is more downside to come in equities. If the market is declining, but volatility is not increasing, it could indicate that investors are not yet fully pricing in the potential risks and uncertainties that are present. In other words, if there is a lack of fear and uncertainty in the market despite declining stock prices, it could suggest that investors are still too complacent and there may be more downside to come.
A market can bottom without implied volatility reaching a new high. While the increase in volatility can indicate fear and uncertainty in the market, it’s not the only factor that determines the bottom of the market. Other factors such as economic indicators, company earnings, and global events can also impact the stock market’s bottom. In some cases, the market can bottom without a significant increase in implied volatility, but it’s important to consider all factors and indicators when assessing the health of the market.
How it works
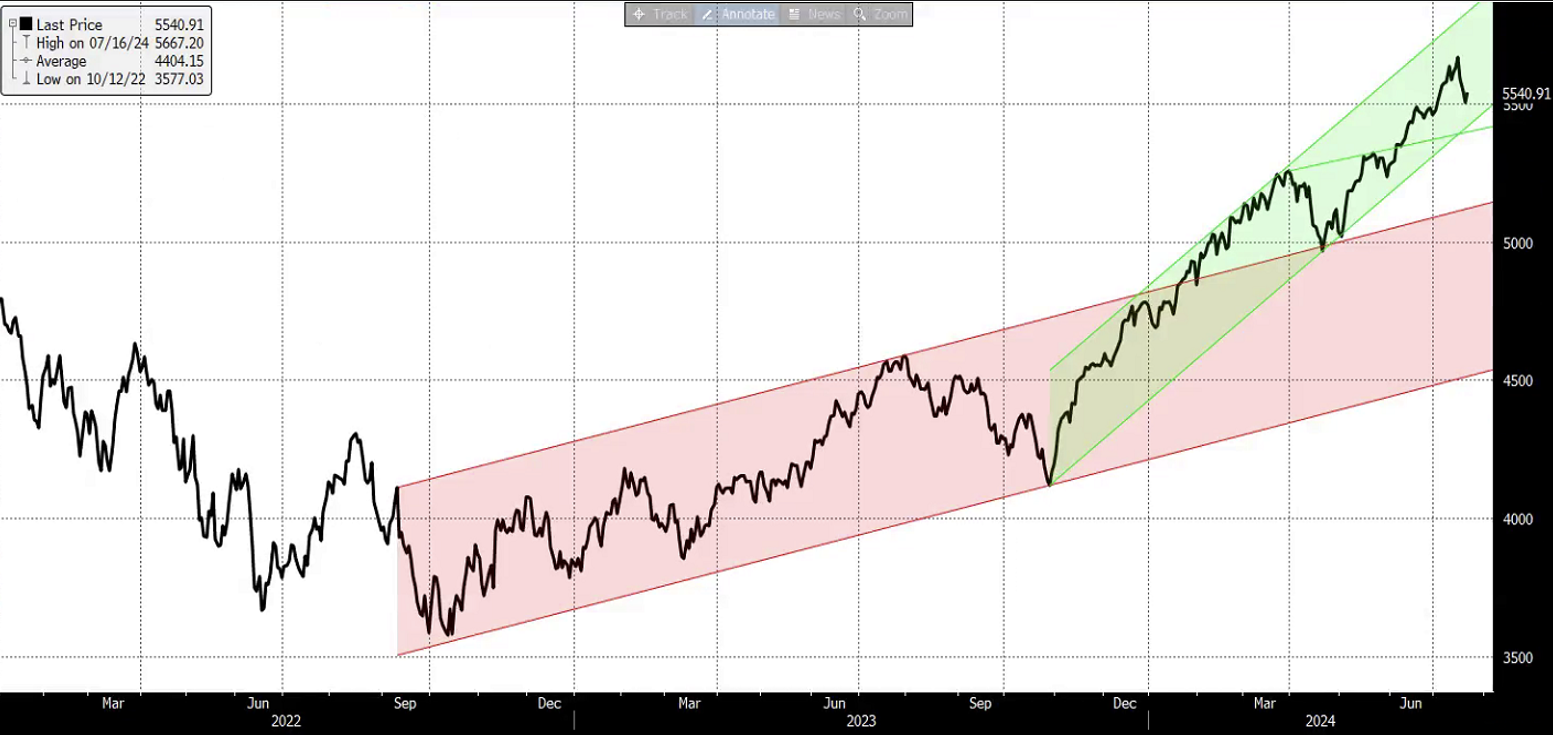
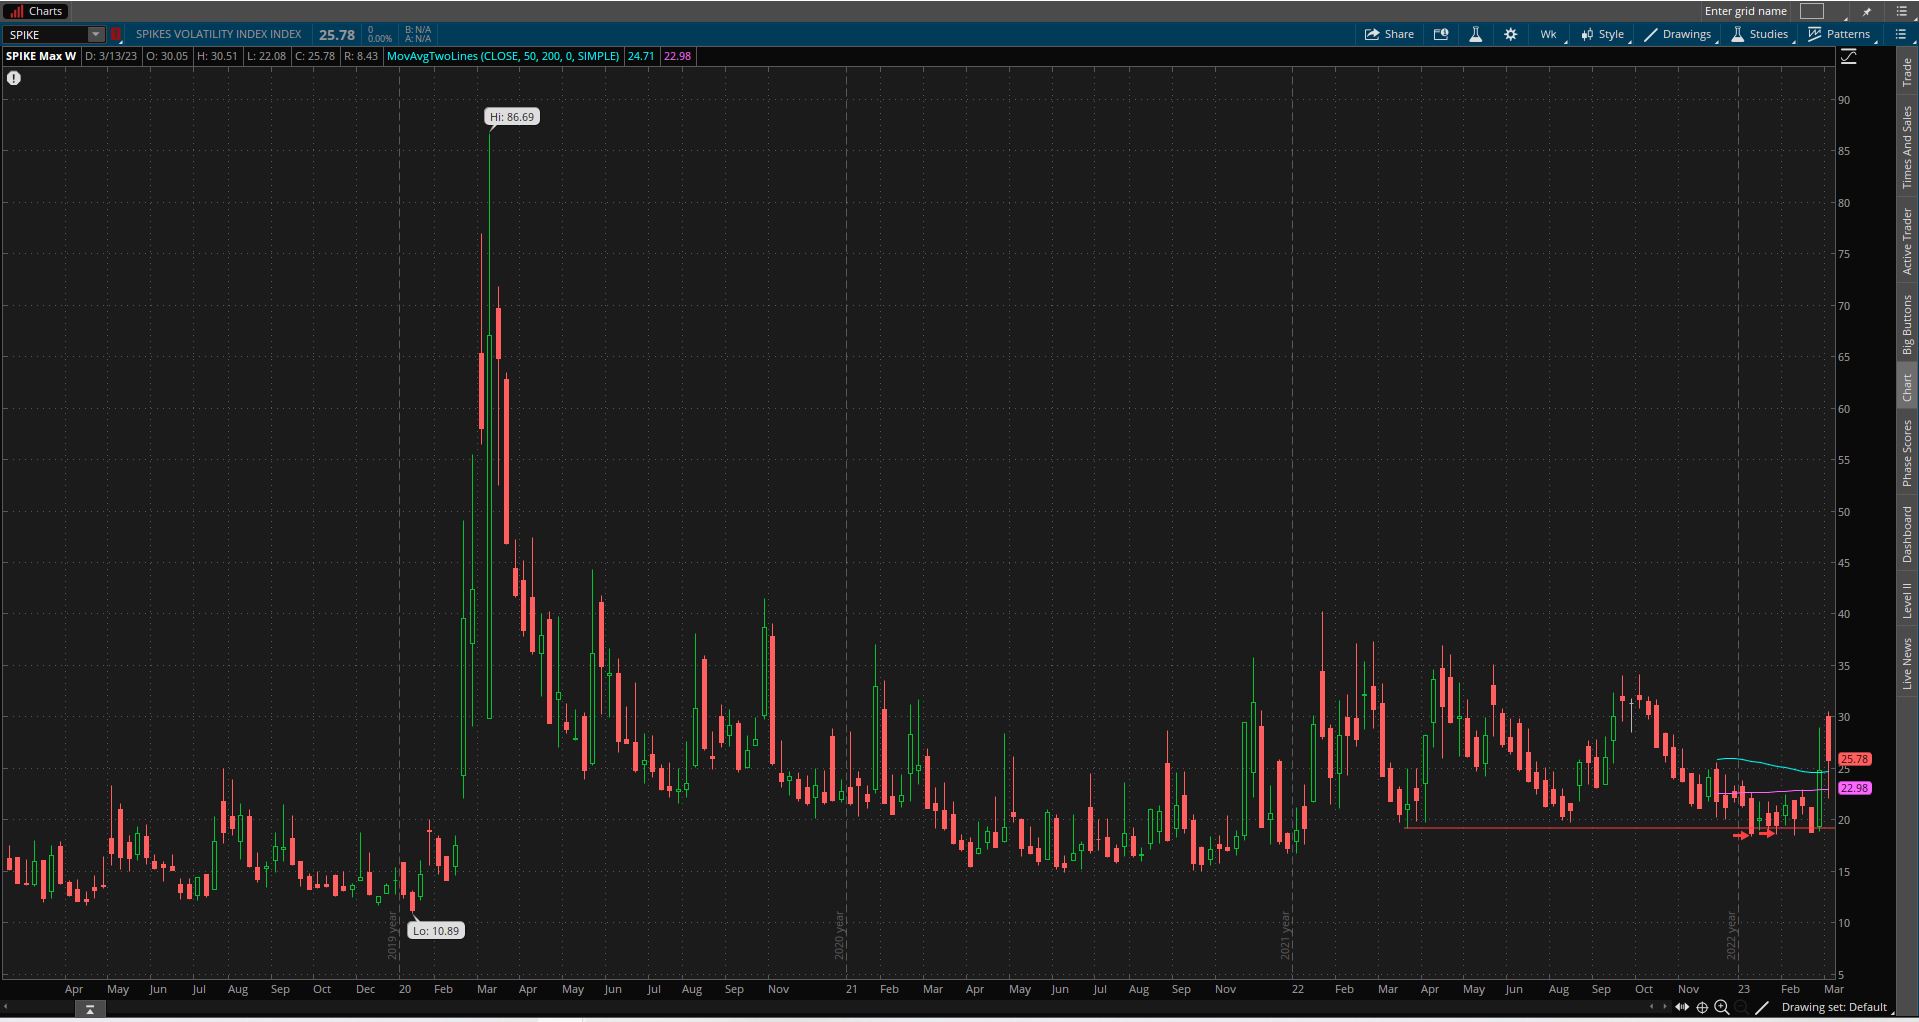
Looking at recent history, we can see the importance of the SPIKES volatility index in predicting market behavior. In 2022, SPIKES hit a high of 40 in January but failed to make a new relative high. This lack of a higher high could be a clue that there was still more downside to come in equities. On the other hand, in 2020, SPIKES peaked out at a staggering 86.69, signaling that the panic had culminated and patient investors could start to get back into equities.
It’s worth noting that historically, volatility in the mid-40s has been a signal of high fear in the market. However, it’s possible that the actions of central banks and the expectations of future central bank actions have kept volatility relatively low. It’s also possible that we have a long way to go before we reach a market bottom, and volatility could increase significantly in the coming months.
Overall, it’s clear that the SPIKES volatility index is a critical tool for predicting market behavior and identifying potential buying opportunities. While volatility is just one factor to consider, it can provide valuable insights into investor sentiment and the health of the stock market. As we move forward, keeping an eye on SPIKES and other key indicators will be essential for staying ahead of the curve and making informed investment decisions.