 Joe Tigay
 From Highs to Lows: How the Yield Curve Predicts Market Volatility Throughout Economic Cycles!
Last week, my blog post focused on the Federal Reserve and their role in managing economic cycles. I discussed how the Fed uses monetary policy to regulate economic growth and avoid recessions. This week, I want to explore another important aspect of the economic cycle, the relationship between the yield curve and volatility. The 3 month 30 year yield curve has been shown to be highly predictive of future market volatility, with different shapes of the curve indicating different levels of volatility. Together, the Fed’s economic cycle management and the yield curve’s volatility cycle can provide a powerful framework for investors to navigate the ups and downs of the financial markets.
Understanding the Yield Curve
The yield curve predicts economic recessions through the inversion of the yield curve. This happens when the yields of short-term bonds are higher than long-term bonds, indicating that investors are less optimistic about the future growth of the economy. The yield curve has inverted prior to every U.S. recession since 1950, making it an important signal for investors. Inverting yield curves warn investors that a recession is looming, as it indicates that the market expects short-term interest rates to be lower in the future than they are currently. This can lead to a decline in borrowing and lending, slowing economic activity and potentially leading to a contraction in economic output.
The 3 month 30 year yield curve is useful for predicting economic growth. A steep yield curve, where long-term rates are significantly higher than short-term rates, is associated with strong economic growth as investors expect inflation to increase and economic activity to pick up in the future. Conversely, a flat yield curve, where short-term and long-term rates are similar, is often a sign of slower economic growth.
The shape of the yield curve also provides insight into the state of the economy and the future direction of interest rates. A steep yield curve, where the spread between short-term and long-term rates is large, is typically associated with a strong economic recovery. This is because investors demand higher returns for lending money over longer periods of time, anticipating higher inflation and stronger economic growth in the future.
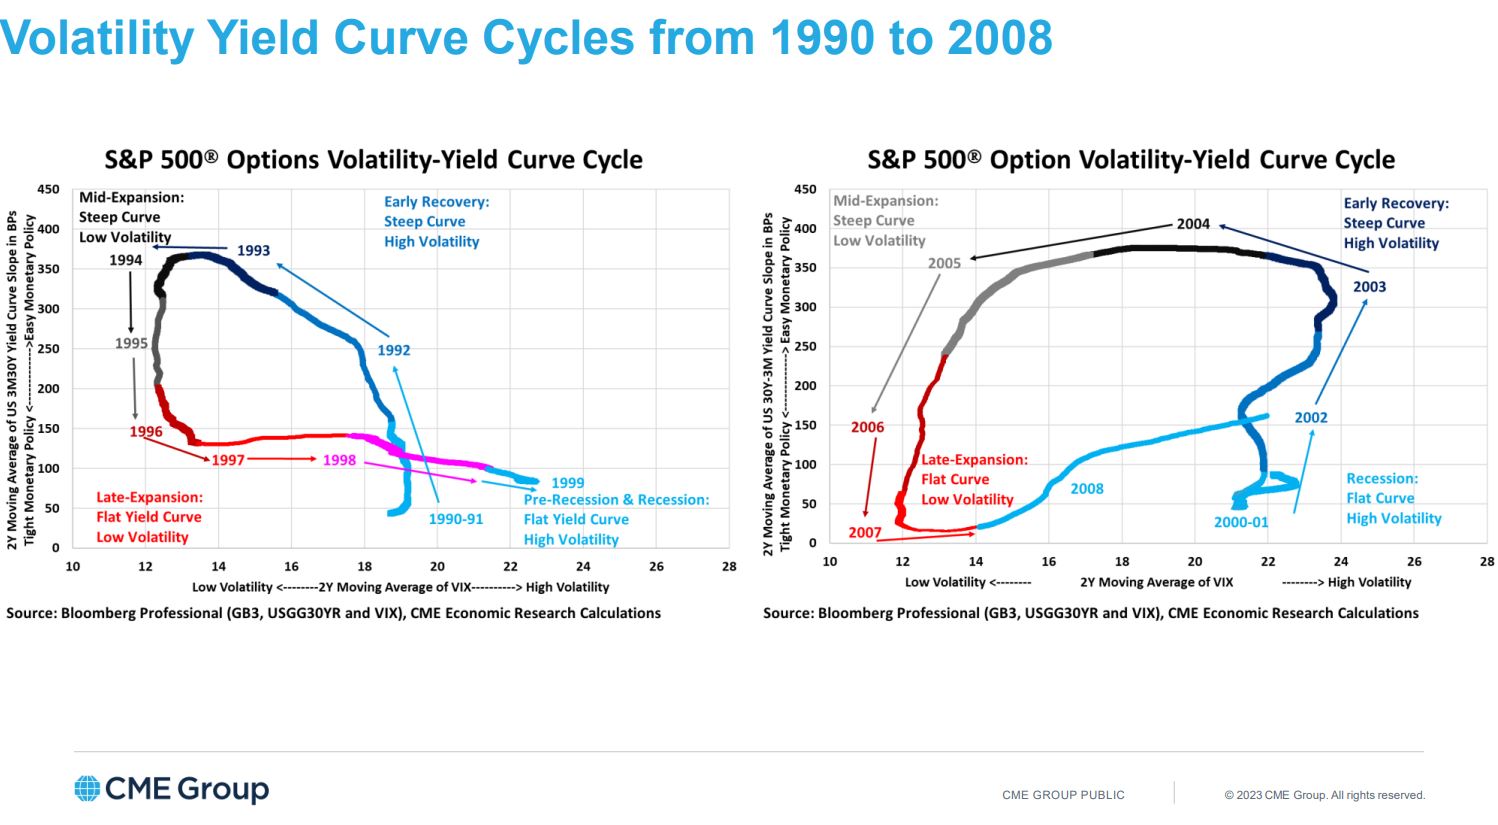
Early Recovery; Steep yield curve high volatility.
During the early stages of a recovery, volatility tends to be high due to the uncertainty surrounding the future direction of the economy. Investors are more likely to take risks and make big moves, leading to increased market volatility.
Mid Expansion; Steep yield curve low volatility
As the recovery progresses, the yield curve tends to flatten as the central bank raises short-term interest rates to curb inflation. This results in lower volatility as investors become more certain about the direction of the economy and adjust their expectations accordingly.

Late Expansion; Flat yield curve low volatility
During the late stages of an expansion, the yield curve is often flat, with little difference between short-term and long-term interest rates. This is a sign that the market is expecting slower economic growth in the future, resulting in lower volatility.
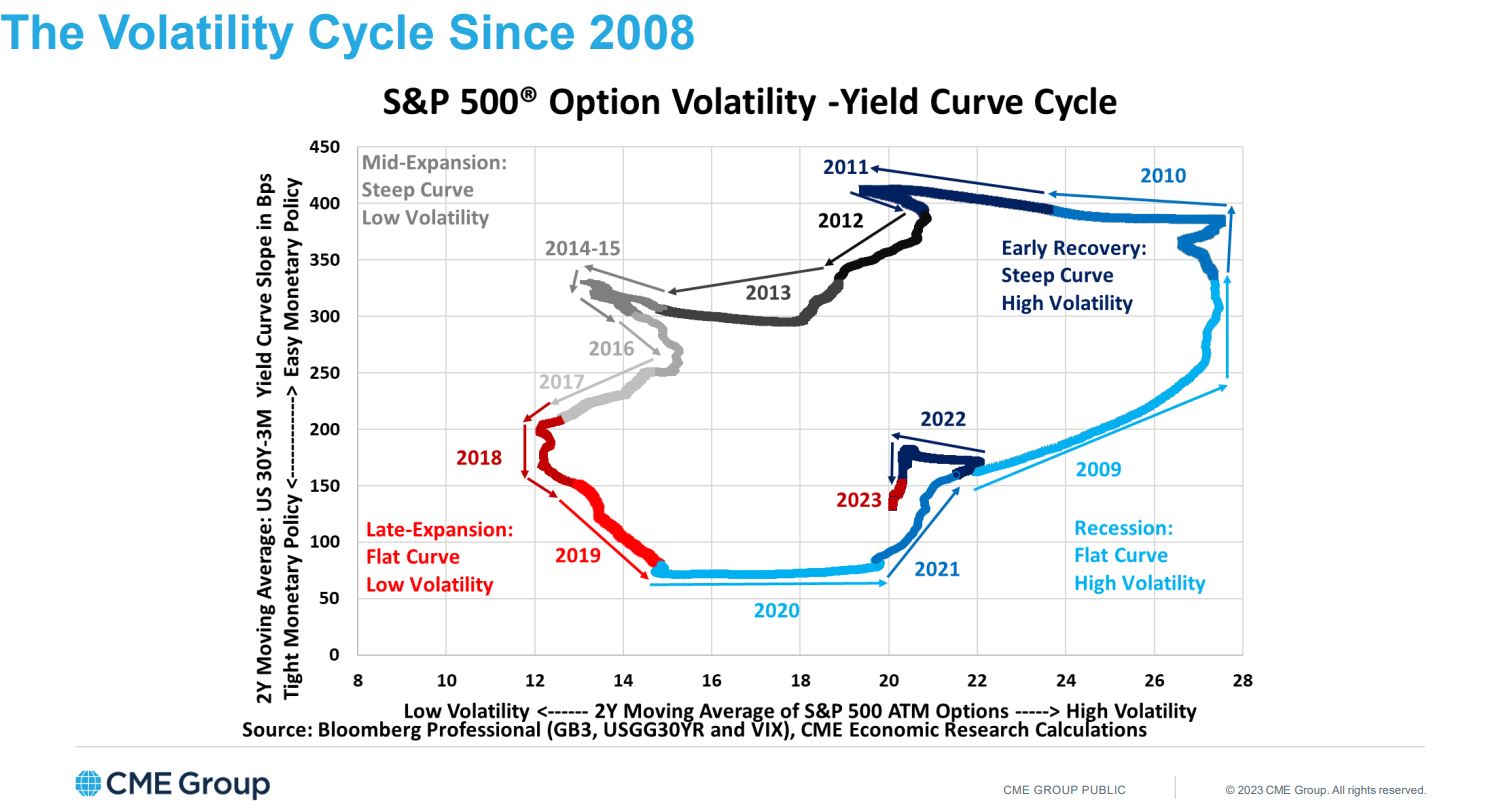
Recession; Flat yield curve high volatility
In contrast, a flat yield curve during a recession or pre-recession period can be a warning sign of an impending economic downturn. Investors may start to panic and make hasty decisions, resulting in higher volatility.
Conclusion
It’s important to note that while these trends are highly predictable and repeatable, there is no guarantee that they will always hold true. Unexpected events or changes in market conditions can lead to deviations from the expected pattern.
The 3-month and 30-year yield curve can provide valuable insights into the state of the economy and future market volatility. By paying attention to the shape of the yield curve, investors can better understand market sentiment and adjust their strategies accordingly.