 Brian Stutland
 The Jackrabbit Case
A few weeks ago, I presented you with the bear case for the stock market, and last week, I gave you the bull case. Depending on the day, both arguments can hold true. But today, I’d like to talk about the jackrabbit case.
When we think about the stock market, we often assume that it moves in a linear fashion. Up or down. However, there are times of uncertainty that the market reacts like a jackrabbit – bouncing up and down, all around.
Now, I know talking about the economy can be a bit of a snooze fest. I mean, who wants to read about inverted yield curves and terminal rates? But hopefully we can cut through the noise and look at the big picture and make it easy on ourselves.
Keep it simple.
I keep on coming back to this chart to remind me where we are in the cycle. We are only in the very early stages of the yield curve steepening and the credit tightening phase on the far left.
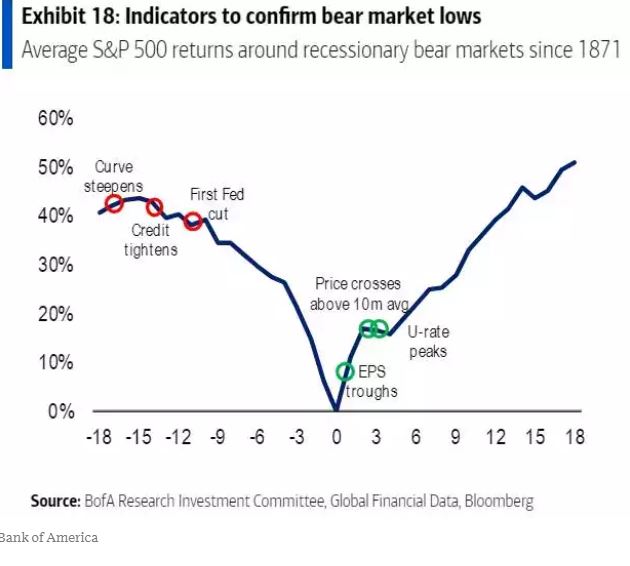
It’s easy to get caught up in the day-to-day movements of the market. We have had conflicting reports about regional banks, the health of the economy, the debt ceiling, and when the timing of rate hikes and cuts. However, it’s crucial to take a step back and consider where we are in the cycle. The Federal Reserve recently signaled that they have reached their final rate hike. This rate hiking cycle was straight into the wind of a sharply inverted yield curve. This was their 11th straight hike, and it was a rapid hike to their terminal rate. The Fed was forced into this action due to an economy that was producing double-digit inflation.
The Dip
Now we are at the point in the cycle where the Fed’s actions can cause the economy to slow down and even go into a recession. However, it’s important to remember that the economy is still being fueled by the same zero-rate policy that caused the inflation to begin with. It takes time for the Fed’s policy to filter through. There are companies who were the beneficiaries of low interest rates who have yet been forced to refinance at higher rates.
To make matters worse, at this stage in the cycle banks need to adjust to the higher rates too. To keep their customers happy, and not risk losing capital, banks need to raise the interest they pay out to cash deposits. The knock-on effect is they then have to be more selective on money they lend and do so at a higher rate. This is known as credit tightening. Which over time reduces the money supply and hopefully lowers inflation. We did momentarily see credit tightening, which started the regional banking crisis. But in either case, we are very early in this chart.
The Bounce
While this is happening, we can see in this chart that as the yield curve begins to correct towards its natural state. Eventually the market will price in cuts to the short term while leaving the long end of the curve steady. At this is stage, the stock market can recover, especially growth stocks with good balance sheets.
Anecdotally, when I go out, I see a booming economy. Malls are packed, shops are full, and there are few discounts to be had. Even the movies are packed. This suggests that the market may continue to bounce up and down like a jackrabbit, but in the long run, it will likely trend upwards.
The end
So, what does this mean for investors? It’s important to stay focused on the big picture and not get caught up in the day-to-day fluctuations of the market. If we are to see a recession starting at the end of the year, we need to keep in mind the chart above. We are likely to JackRabbit up and down until there is clarity. Remember that the market will always have ups and downs, and it’s crucial to have a well-diversified portfolio that can weather any storm.
 Joe Tigay