 Joe Tigay
 History is Projecting Volatility to SPIKE in 2024
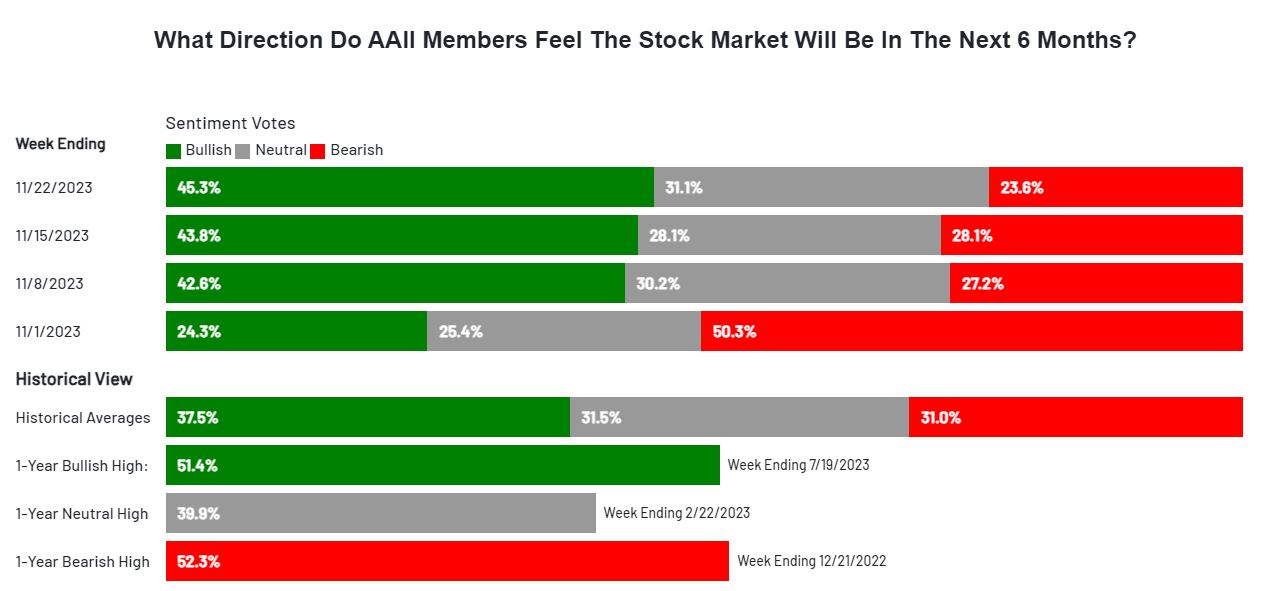
The AAII Investor Sentiment is painting an intriguing picture as we step into the third week of increasing bullish sentiment. Let’s rewind a bit and recall that this November rally took off when bearish sentiment was flirting with the 52-week high. What catches my eye this week, amid another surge in bullish sentiment, is the notable drop in the bearish camp. The spread between the bulls and bears is widening, signaling contrarian territory. Last week, we noted the absence of clear signals for the bears, but this shift is beginning to align with their interests.
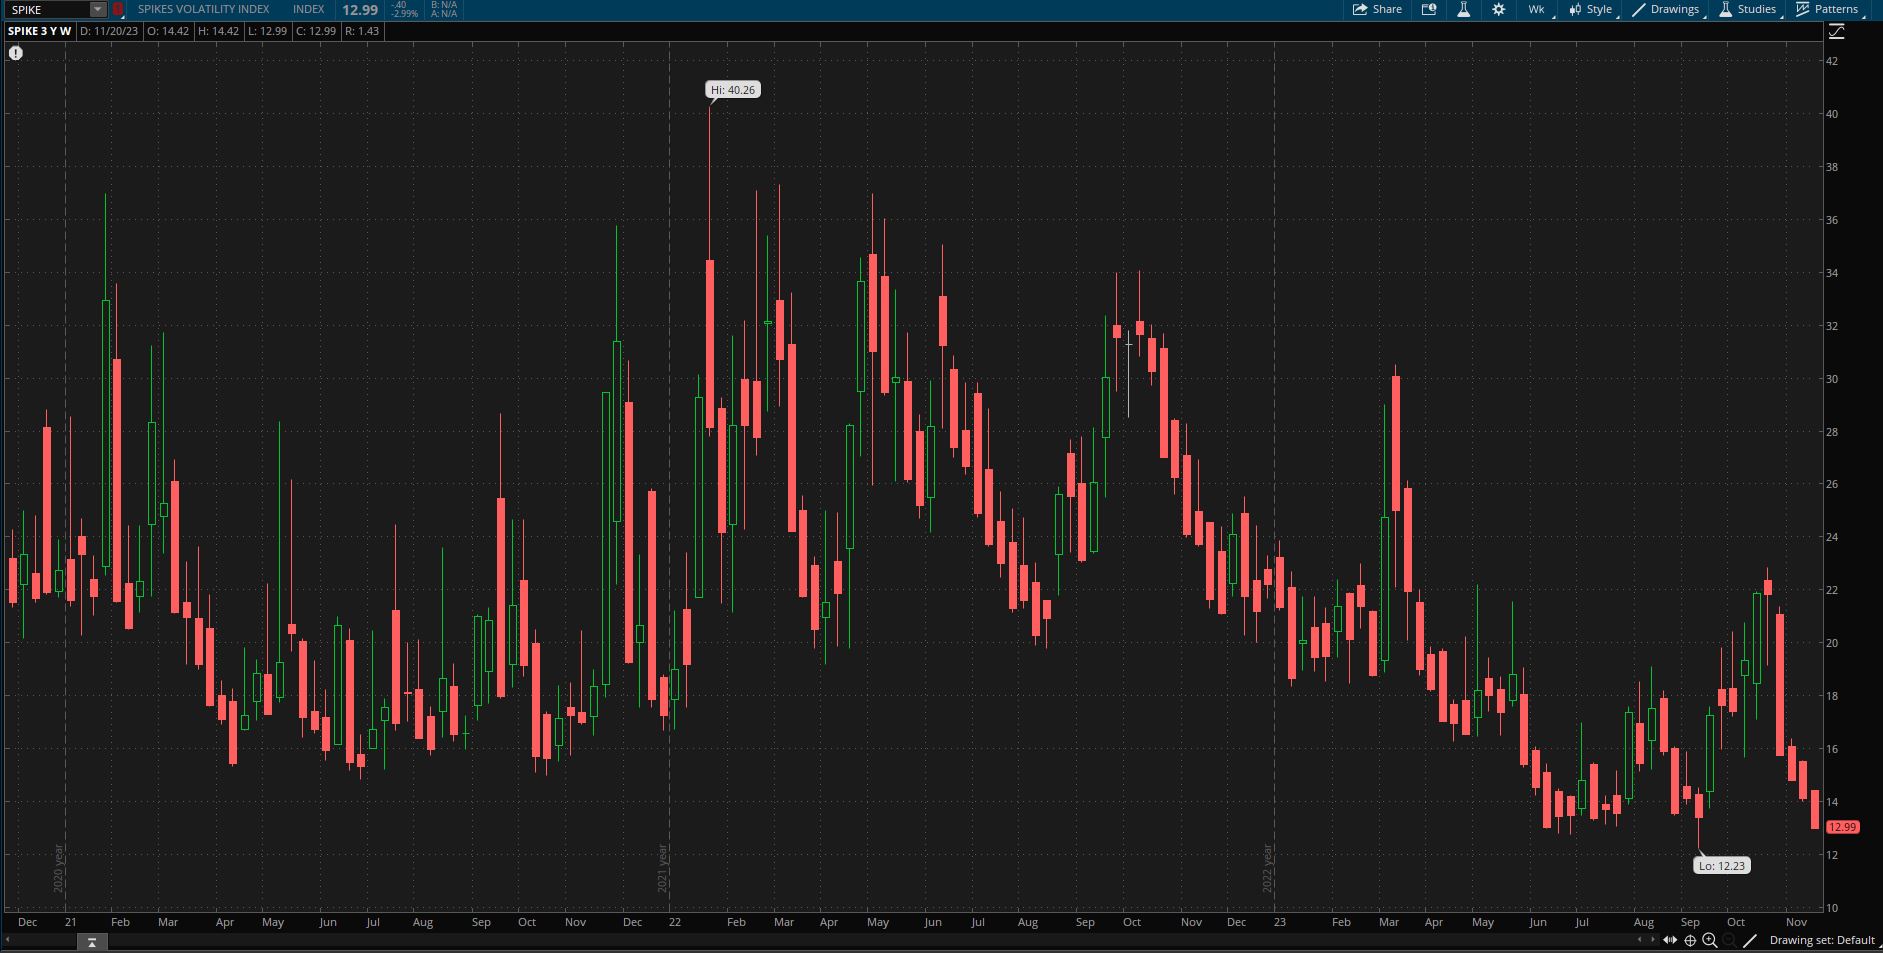
In a blink, the Spike Index closed below 13 at the end of the Thanksgiving-shortened week. The November rally has ushered in stock levels of volatility at some of the year’s lowest points. But, peering into history, what insights can we glean about the future of volatility?
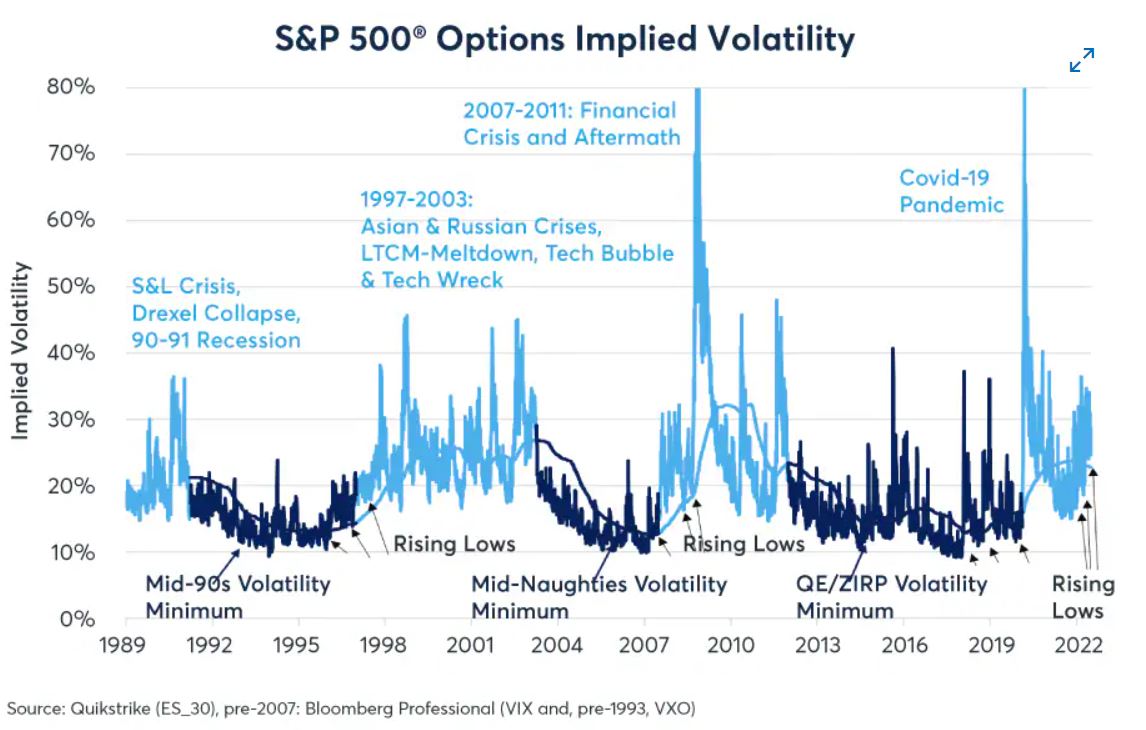
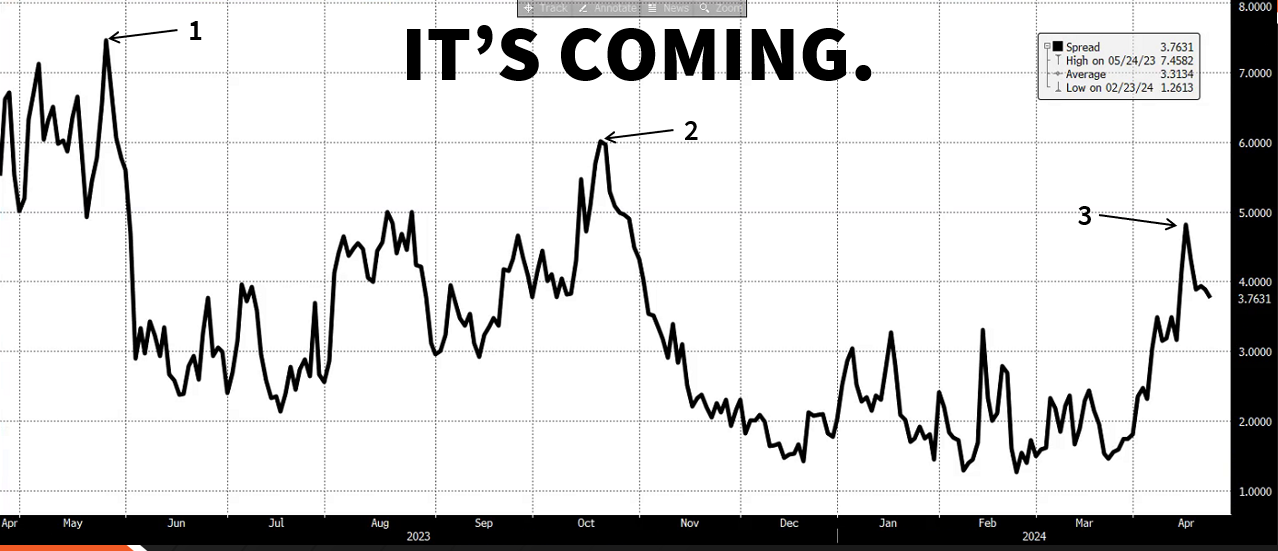
Considering the shape of the yield curve, historical patterns point towards 2024 as a year brimming with higher-than-usual volatility. Currently inverted, the yield curve hints at the Fed maneuvering through a tightening cycle. Historically, the end of such tightening cycles marks a low point for volatility. Once the Fed initiates an easing policy, volatility tends to rise. Significantly, when the Fed ceases its easing, we witness the pinnacle of volatility, often associated with the steepest yield curve.
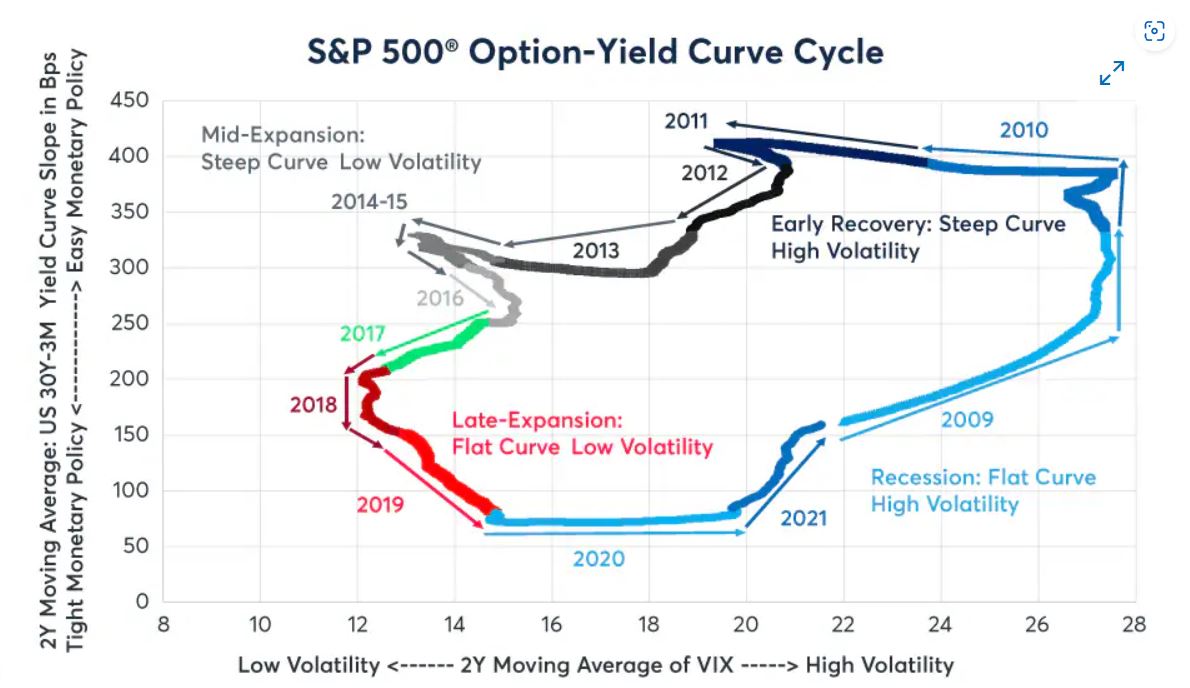
If we project the Fed to conclude its hiking and embark on easing in 2024, the stage is set for a spike in volatility during the election year. Picture it akin to 2007, a year where both the market and volatility soared to new heights.
In essence, the current landscape suggests that the bears might find their footing in the shifting sentiment, while the calm waters of low volatility could be the precursor to a storm brewing in 2024. Investors, brace yourselves, for the waves of history may be preparing to crash upon our portfolios once again.