Bloomberg
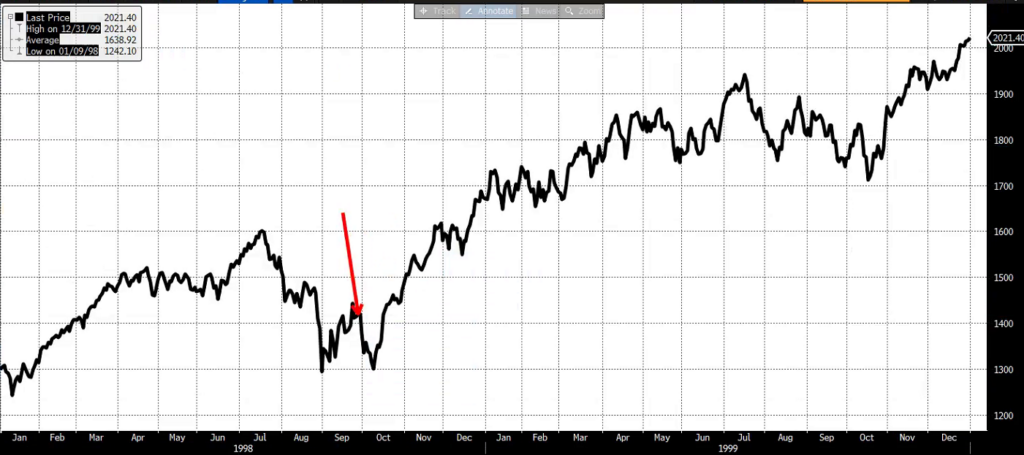
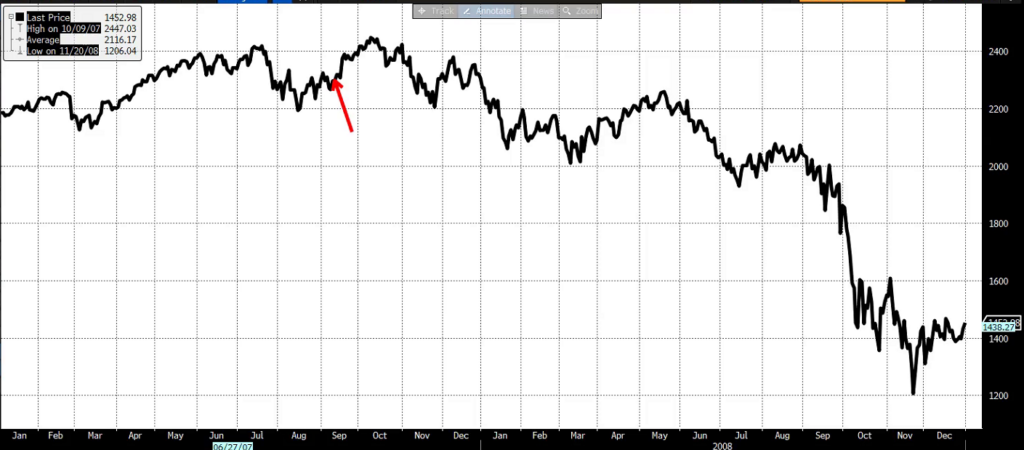
Historical Context and Current Trends A recurring pattern emerges in financial markets: a steepening yield curve often coincides with increased volatility. This phenomenon is evident in both 2007 and 1998, as well as other periods of economic downturn.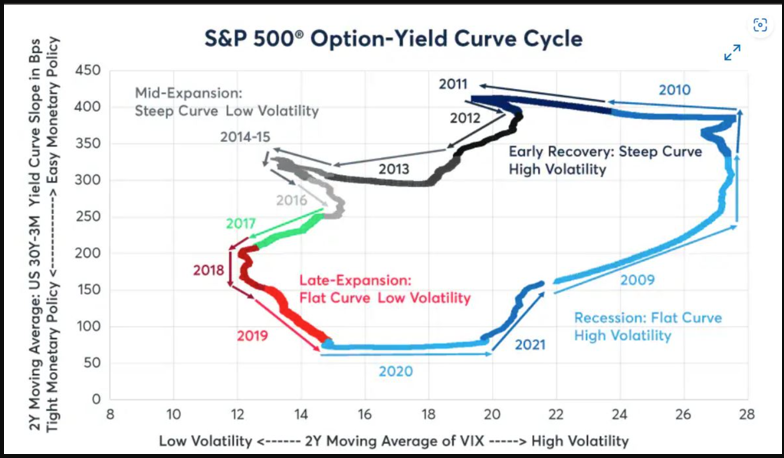
Source CME Group
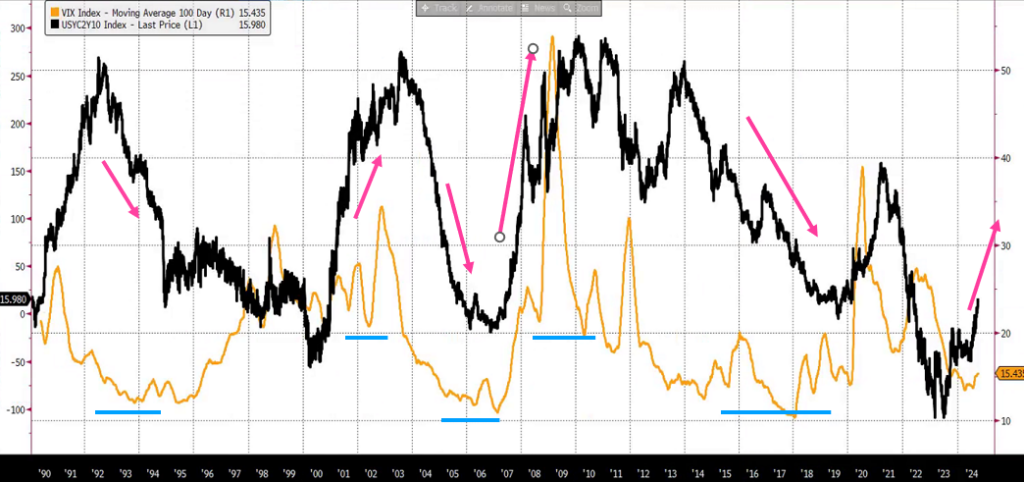
- The Volatility Cycle: The yield curve's movements often correlate with cyclical volatility patterns. A flat yield curve, typically associated with the end of an economic expansion and higher interest rates, often precedes a period of lower volatility. When the Federal Reserve cuts rates, steepening the yield curve, volatility tends to rise. This peak in volatility often coincides with the steepest point of the yield curve.
- The 2007 and 1998 Comparison: While both 2007 and 1998 featured a steepening yield curve and rising volatility, the underlying causes differed. In 1998, a volatility shock triggered by the Russian debt crisis prompted the Fed to lower rates. Conversely, in 2007, the Fed's rate cuts were a response to a deteriorating labor market.
Bloomberg
To navigate today’s economy effectively, we must understand its historical roots. As an advisor, it’s vital to have open, transparent conversations with clients, comparing past crises with current challenges. Staying disciplined and invested during volatile periods is key to long-term success. A strong plan with smart risk management helps investors ride out downturns and prepare for growth. Volatility is cyclical, often spurred by Federal Reserve rate cuts. Recognizing these patterns enables investors to minimize risks and handle uncertainty with confidence. Conclusion As the financial landscape continues to evolve, understanding the historical context and current trends is essential for making informed investment decisions. By recognizing the cyclical nature of volatility and leveraging specialized strategies, investors can mitigate risks and protect their portfolios from market downturns.