 Brian Stutland
 For people who want to begin buying into this sell off selling puts is a good way to go because you can effectively get paid to lock in a price you are willing to buy at. However, selling puts means that you have all of the risk on the downside as a long stock position so you must be comfortable with the risks of owning the stock at the strike price. For people trying to pick a bottom in the S&P 500 but who don’t want to take delivery of the stock I recommend turning this trade into a put spread by buying a deep out of the money put as a hedge.
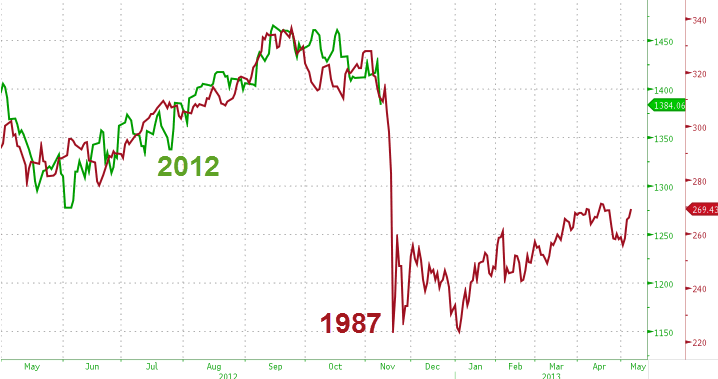
The case for keeping risk fixed and portfolios hedged is this chart, which overlays the price action around the 1987 crash with today’s market.
Ahead of the open futures are down but off their lows, and given the options order flow yesterday I would be surprised if the market did not at least attempt to reverse some of yesterday’s sell off. Apple has been a great leading indicator of the overall market the past few months and in pre-market trading is up on the day and nearly $10 off its overnight lows, which coincided perfectly with a 50% Fibonacci retracement from its November ‘11 – October ’12 rally.

 Joe Tigay