 Joe Tigay
 2/10 Yield Curve and the Popping of Economic Bubbles
The 2/10 yield curve is a widely recognized economic indicator that accurately predicts recessions, but its limitations and the tendency for the stock market to rise even as the curve becomes more inverted highlights the need for a deeper understanding of this indicator and the importance of learning from past economic bubbles to prepare for future downturns.
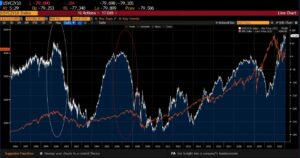
The 2/10 yield curve is a widely watched economic indicator that reflects the difference in yield between a 2-year Treasury bond and a 10-year Treasury bond. An upward sloping yield curve, where the yield on the 10-year bond is higher than that of the 2-year bond, is considered normal. However, an inverted yield curve, where the yield on the 2-year bond is higher than that of the 10-year bond, is often seen as a strong predictor of an upcoming recession.
While the 2/10 yield curve has been an accurate predictor of recessions, it is important to note that it can be forward looking. Historically, while the yield curve is becoming more and more inverted, the stock market often rises with it. This can be seen in the 2000 tech bubble and the 2007 housing bubble.
2/10 Yield Curve Inversion in 2000
The tech sector was booming, and investors were eager to invest in technology stocks, driving up the prices of these stocks. This created a huge stock market bubble that eventually burst, leading to a significant economic downturn.
2/10 Yield Curve Inversion in 2007
Housing prices in the United States saw a dramatic increase, driven by a combination of low interest rates, easy credit, and speculation. This created a housing bubble that eventually burst, causing a massive economic crisis.
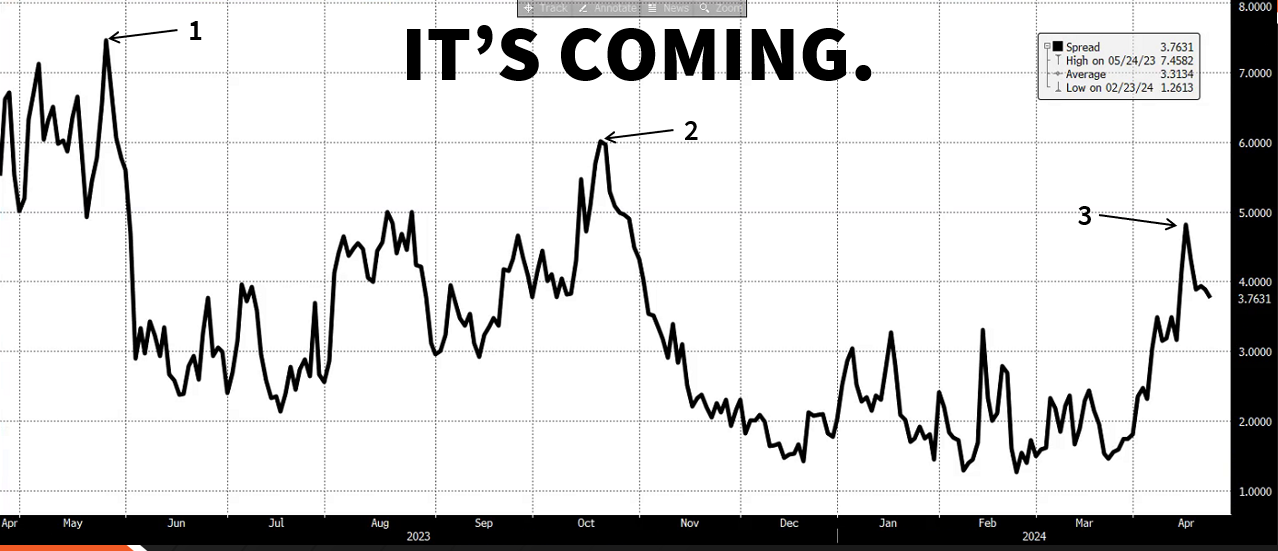
In 2023?
So, what is bubbling up now in 2023? It is hard to predict the exact source of the next bubble, but it is important to be mindful of any potential risks in the market and to learn from our previous mistakes.
Why can’t we learn from our previous mistakes when it comes to financial history? Human nature often leads us to be optimistic and to overlook warning signs during boom times. It is also important to remember that bubbles are often driven by complex factors and can be difficult to identify until it is too late.
The 2/10 yield curve is a fantastic predictor of recessions, but it is important to remember its limitations and to be mindful of potential risks in the market. By learning from our previous mistakes, we can be better prepared for any potential economic downturns in the future.